 just-dna-lite
Frequently Asked Questions
About the Project
What is just-dna-lite?
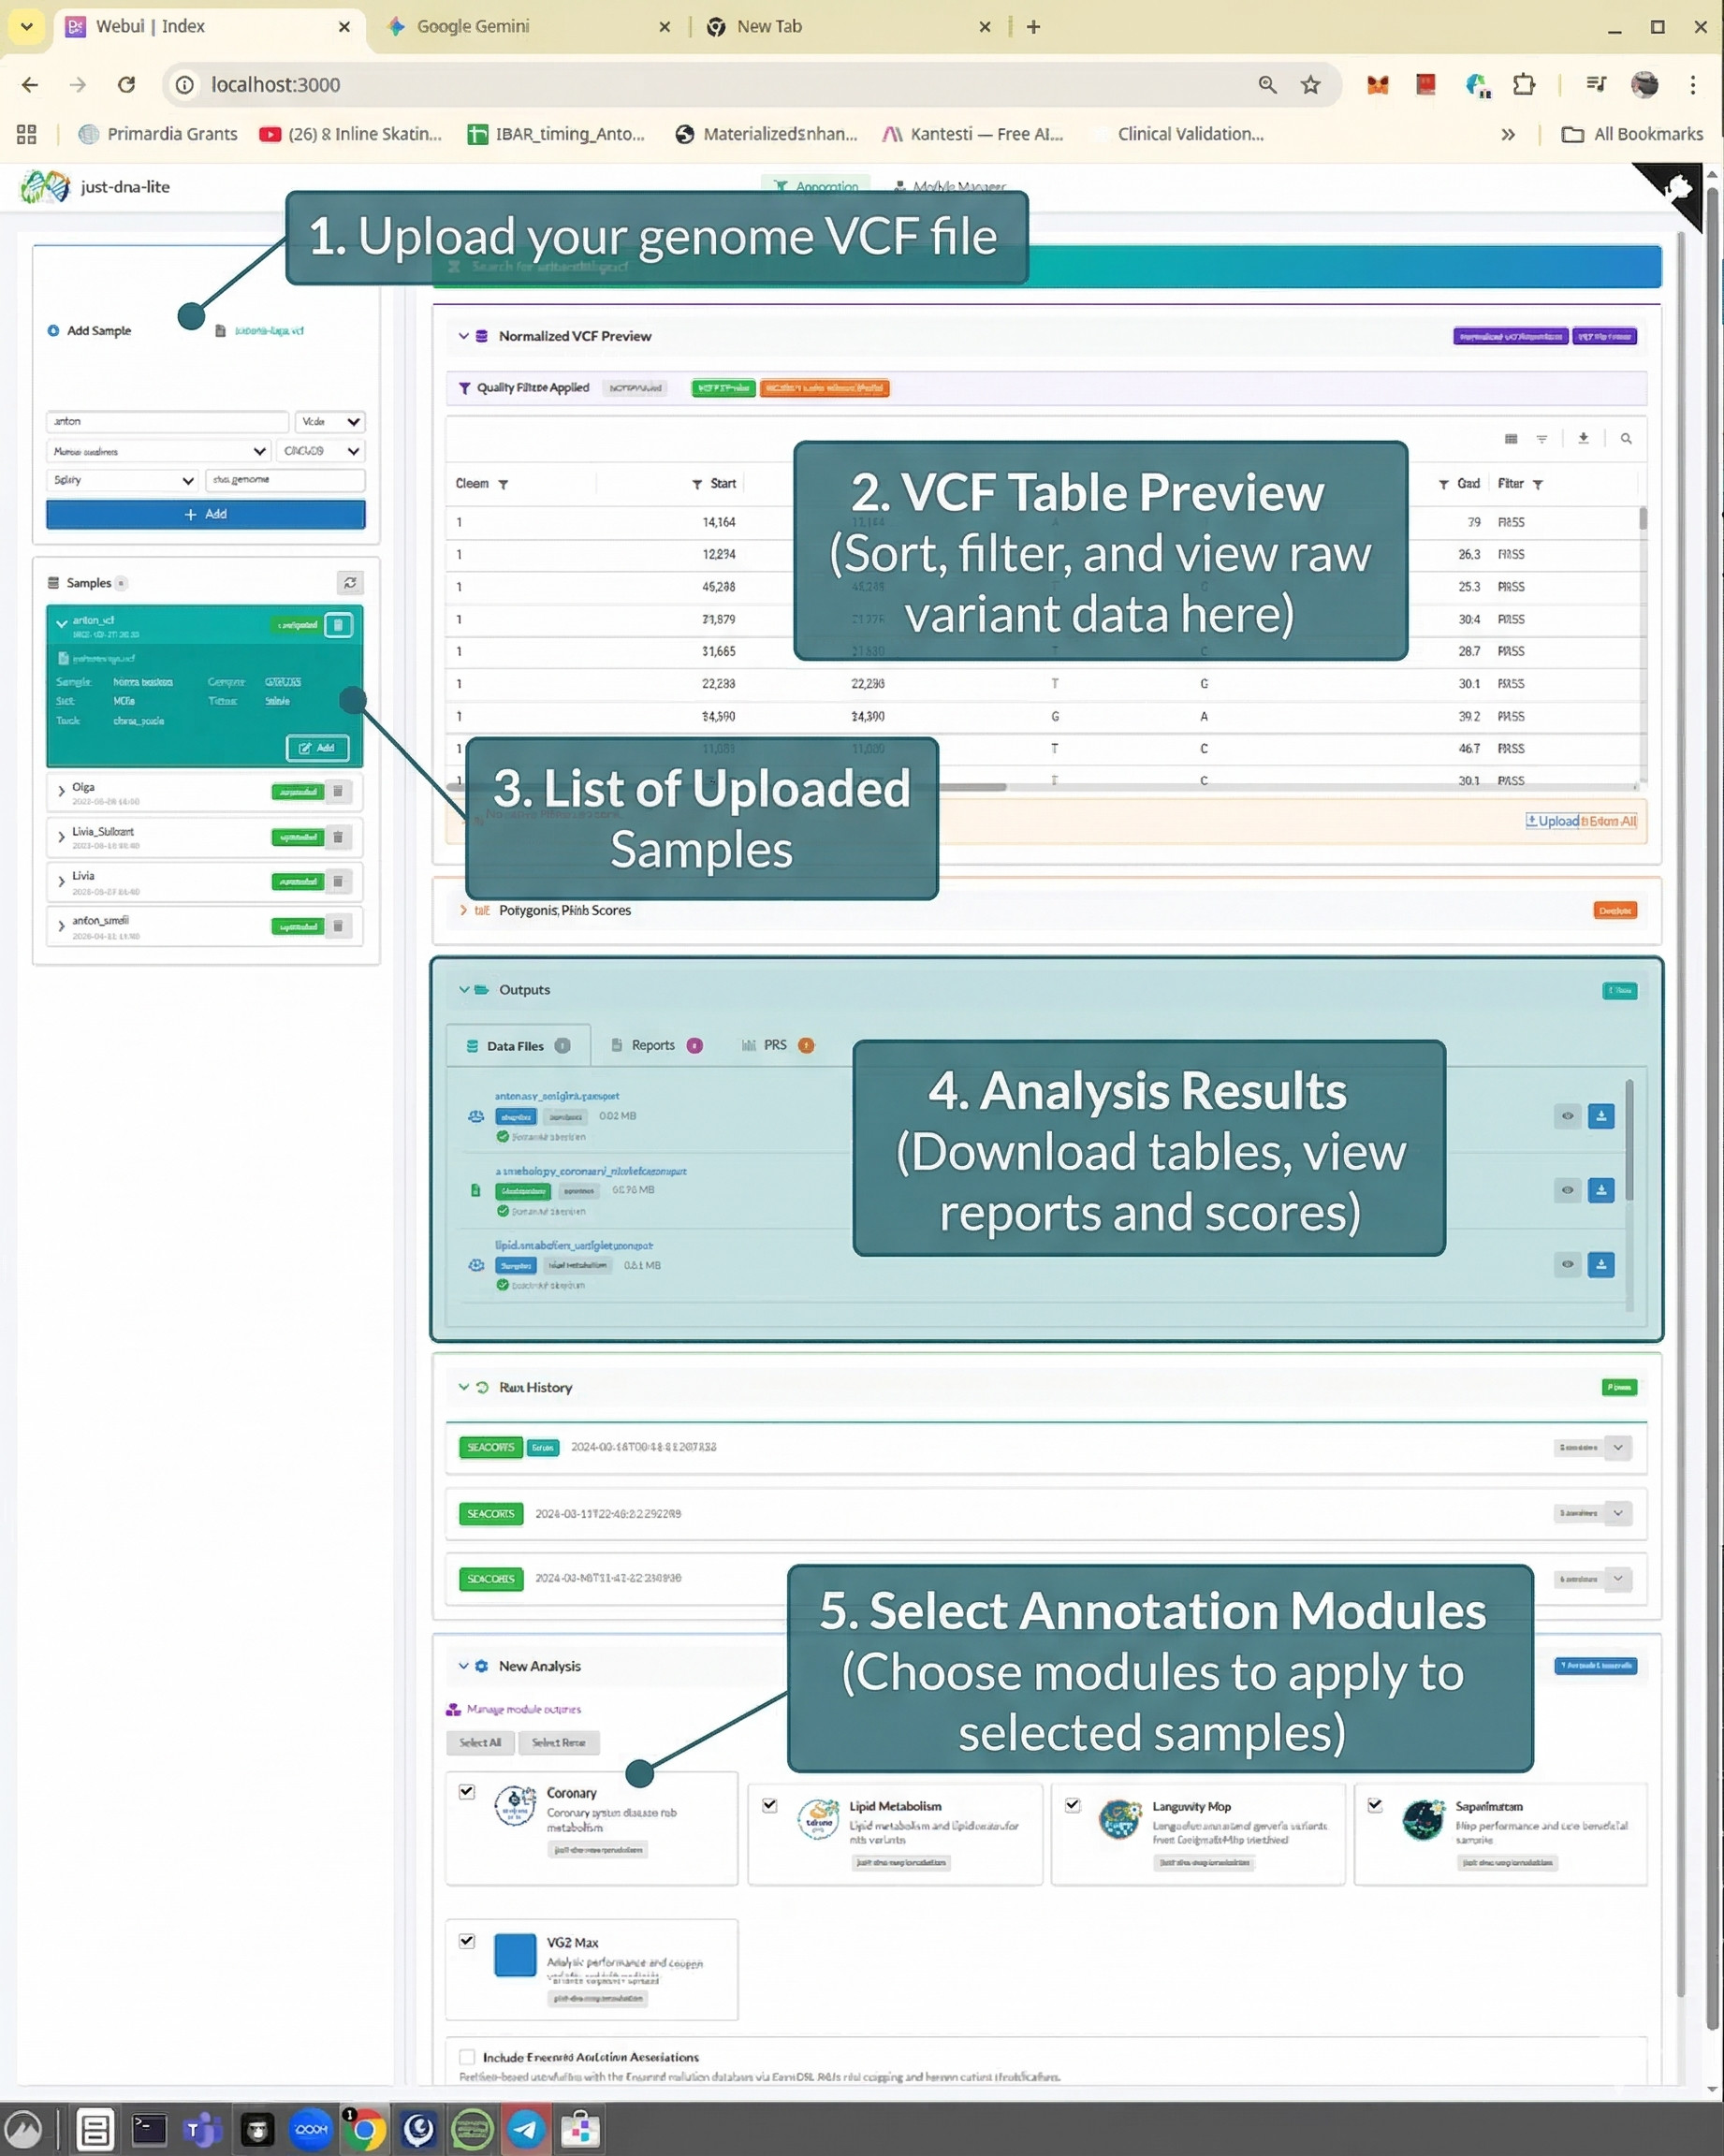
just-dna-lite is an open-source platform for personal genome annotation. You upload a genome file (VCF), pick what you want to know, and get results in minutes. It runs entirely on your machine — nothing leaves your computer. The source code is on GitHub under the AGPL v3 license.
Who is behind this project?
The project was started by Anton Kulaga and Nikolay Usanov, who wanted to understand their own genomes and got tired of being the bioinformaticians without shoes — building tools for everyone else but having nothing good for personal use. Other contributors joined along the way, including geneticist Olga Borysova who built the expert-curated annotation modules. The full list is on the GitHub contributors page.
Where is the source code?
Everything is on the dna-seq GitHub organization:
- just-dna-lite — the main platform
- just-prs — polygenic risk score library
- prepare-annotations — upstream data preparation pipelines
Annotation modules and reference datasets are published to the just-dna-seq organization on HuggingFace.
How do I install it?
See the Quick start section in the README. It runs on Windows, macOS, and Linux — installers are available for Windows and macOS, and on Linux you can run from source in four commands. No Docker required (though container deployment is also supported).
What file format does it accept?
VCF (Variant Call Format) files with .vcf or .vcf.gz extensions from whole genome (WGS) or whole exome (WES) sequencing. GRCh38-aligned VCFs are the primary supported path, and GRCh37/hg19 is handled through liftover. T2T support is planned.
Does it work with 23andMe / AncestryDNA / MyHeritage data?
Experimentally. Those services use microarray chips that read a few hundred thousand pre-selected positions, so results are much sparser than whole genome or whole exome sequencing. just-dna-lite works best with WGS/WES VCF files, but consumer microarray data can be explored with lower coverage.
Where can I get my genome sequenced?
Several commercial providers offer whole genome sequencing. As of 2026, options include DNA Complete (formerly Nebula Genomics), Dante Labs, and Sequencing.com. Make sure your provider allows you to download the raw .vcf or .vcf.gz file.
If you live in Romania, the ROGEN (Romanian Genomics) project is a national initiative sequencing 5,000 individuals — you might be able to participate and get your genome sequenced.
(We are not affiliated with any of these companies or services.)
I don't have a genome file. Can I still try the tool?
Yes. Some of our authors have voluntarily open-sourced their genomes under permissive licenses:
- Anton Kulaga (CC-Zero):
https://zenodo.org/records/18370498 - Livia Zaharia (CC-BY-4.0):
https://zenodo.org/records/19487816
Paste these URLs into the "Import from Zenodo" field in the app, or download the VCF and upload it manually. You can also find other public genomes on platforms like Open Humans.
Understanding the Science
What does running an annotation module actually tell me about my genome?
Each module is a curated database of genetic variants with effect weights from published research. When you run an annotation, the tool joins your VCF against the module's variant table and shows which of your variants match, along with context from the source studies — whether a variant is considered protective or risky, the gene involved, and a brief conclusion from the literature.
Which modules can I run on my genome?
The tool ships with six expert-curated modules: Longevity Map (variant-trait associations from the LongevityMap database), Coronary Artery Disease, Lipid Metabolism, VO2 Max, Athletic Performance (Superhuman), and Thrombophilia (inherited blood-clotting risk variants). These come from the expert curation of geneticist Olga Borysova. More modules can be added by hand or generated with the AI Module Creator.
What does turning on Ensembl annotation give me?
When enabled, the pipeline joins your variants against the Ensembl Variation database (~1.1 billion rows). This provides clinical significance labels, consequence types, and cross-references for each variant. The Ensembl cache is about 14 GB and is downloaded on first use. You can pre-download it with uv run pipelines ensembl-setup.
What is a polygenic risk score (PRS), and what does my number actually mean?
A PRS is a weighted sum of genetic variants from genome-wide association studies. The result is a number that tells you where you sit in a reference population's distribution. It is a rank, not a probability of disease. The model is linear; real biology is not — gene-gene interactions, gene-environment interactions, and developmental factors are not captured.
Over 5,000 PRS from the PGS Catalog are available. Scores are computed via just-prs with Pearson r = 0.9999 concordance against the established PLINK2 reference tool.
My report mentions "heritability" — does that mean my genes decide my fate?
When scientists say a trait is "60% heritable," most people read "60% determined by genes." That is not what it means. Heritability is a population-level statistic — it measures how much of the variation between people in a specific study is associated with genetic differences. It changes depending on the environment. Height is about 80% heritable in well-nourished populations; that number drops in populations with childhood malnutrition. The genes didn't change. The environment did.
A high heritability does not mean "your genes doom you." It means the number depends on the population and environment where the study was done.
Is a variant the tool flagged a proven cause, or just a statistical link?
No. Most variants in annotation modules are statistical associations found through genome-wide association studies. Many GWAS hits are "tagging" variants — correlated with a nearby causal variant but not causal themselves. Effect sizes also consistently shrink in replication studies.
I'm not of European ancestry — can I trust my PRS?
Less accurate, sometimes substantially. Most PGS Catalog scoring files were derived from predominantly European cohorts. The statistical associations depend on allele frequencies and linkage disequilibrium patterns that vary across populations. just-prs provides percentile ranking against five 1000 Genomes superpopulations (African, American, East Asian, European, South Asian), but the underlying scores were still mostly built from European data.
I ran several PRS for the same trait and they disagree — which one do I believe?
This is normal, and it is one of the most useful things the tool can show you. There are dozens of published PRS models for popular traits like type 2 diabetes or coronary artery disease, and they often put you in different percentiles. That spread is not a bug — it reflects real uncertainty in the science, and seeing it is more honest than a single tidy number.

Six PRS models for the same trait, shown together. The bell curve marks where each model places you, with the median across models highlighted; the right panel shows each model's variant match rate (green = better coverage, orange = poor), and the models are tiered by quality. Here the models scatter from roughly the 50th to the 99th percentile — so the honest read is the consensus and the high-quality, well-covered models, not any single number.
Why they disagree:
- They were built differently. Each model used a different set of variants, a different training population, a different statistical method, and a different study size. Naturally they give somewhat different answers.
- They cover your genome differently. One model might find 95% of its variants in your file and another only 40%. A low "match rate" means only part of that model was actually applied to you.
- They are not on the same scale. The raw score from one model cannot be compared directly to another's — so you should never average the raw numbers. The comparable unit is the percentile within a reference population, which is what the tool shows.
- Quality varies a lot. Some models are large, recent, and well-validated; others are small, old, or weakly predictive.
How to decide what to trust — the tool gives you the signals:
- Use the trait summary, not one score in isolation. When you compute a whole trait, just-prs groups all the models into a consensus view, marks where they agree, and flags outliers — so you can see the cluster, not cherry-pick one number.
- Prefer higher-quality models. Lean on the ones with a higher quality tier and discrimination score (AUROC/C-index), larger and more recent training cohorts, and a reference population that matches your ancestry.
- Check coverage. A high or low result from a model with a poor variant match-rate in your genome is unreliable — weight it less.
- Be cautious with "harmonized" scores. Models that had to be coordinate-converted to your genome build carry extra uncertainty and are marked as such.
- Read the agreement itself as information. If the good-quality, well-covered, ancestry-matched models cluster together, that consensus is more trustworthy than any single outlier. If even the good models scatter widely, the honest conclusion is that PRS does not yet give a confident answer for you on this trait.
And, as everywhere: a PRS is a population-relative rank, not a diagnosis. No amount of model agreement turns it into a clinical result — for anything you would act on, confirm with a clinician and standard validated risk assessment.
I found a high PRS or a "pathogenic" variant and I'm worried — what should I do?
Don't panic. This is research-grade information, and context matters enormously.
Studies of healthy populations show that the average person carries dozens to hundreds of variants flagged as "pathogenic" in research databases. Many of these entries are false alarms, reclassified over time, or have very low penetrance (meaning they only cause disease in a tiny fraction of carriers). For common chronic diseases, lifestyle factors — smoking, activity, diet, sleep — have larger effect sizes than any common genetic variant.
We built this tool for exploration and self-education. We know people will look at their health-related results, and that is the whole point — you have the right to look at your own genome. But you need to know what you are looking at: this is research-grade evidence, not a clinical test. If something concerns you, especially if it aligns with your family history, the right next step is to talk to a doctor or genetic counselor and get the finding validated with a clinical-grade test (like Sanger sequencing from a certified lab). The danger is not in looking — it is in acting on research-grade results without proper validation.
For a deeper dive, see Understanding What Your Genome Can and Cannot Tell You.
Which of my results can I actually take seriously?
A small number of genetic findings are near-deterministic and clinically actionable:
- Monogenic diseases — one or two broken copies of a gene cause a specific disease with high penetrance. Examples: Huntington's disease, familial hypercholesterolemia (LDLR, APOB, PCSK9), hereditary BRCA1/2 breast/ovarian cancer, Lynch syndrome.
- Pharmacogenomics — CYP2C19 loss-of-function affects clopidogrel activation; HLA-B*57:01 predicts abacavir hypersensitivity. These have direct clinical implications.
- High-penetrance rare variants — e.g., APOE e4/e4 for Alzheimer's, TTR for hereditary amyloidosis.
Everything outside this short list — the vast majority of what a genomic tool surfaces — is associative, probabilistic, and heavily context-dependent.
Could my scary result actually be a false alarm? Has that happened to real people?
Yes — several are well documented, and they are worth knowing before you act on anything you see here.
-
A single variant misclassified as "pathogenic" (hypertrophic cardiomyopathy). In a landmark study, Manrai et al. (NEJM, 2016) showed that several variants once reported as disease-causing for hypertrophic cardiomyopathy were in fact benign. Patients — disproportionately of African ancestry — had been told they carried a deadly heart-disease mutation, prompting years of at-risk screening and lifestyle changes for them and their relatives. The root cause was that the early control populations were overwhelmingly white, so common-but-harmless variants in other ancestries looked "rare and therefore pathogenic." A single SNP, read without the right population context, produced real misdiagnoses (Manrai et al. 2016).
-
A "negative" result that wasn't (BRCA / breast and ovarian cancer). Direct-to-consumer BRCA testing originally checked only three Ashkenazi-Jewish founder variants — out of more than a thousand known pathogenic BRCA mutations. People without Jewish ancestry who got a "no variants found" result could be falsely reassured, while still carrying a high-risk mutation the test never looked for. The FDA itself warned that a negative result does not rule out increased cancer risk (FDA / breastcancer.org). The lesson: absence of a flagged variant is not absence of risk, especially when the test (or module) only covers a subset of variants.
-
Over-interpreting low-impact variants (MTHFR). MTHFR C677T is one of the most over-interpreted variants in consumer genetics. The American College of Medical Genetics and Genomics recommends against routine MTHFR testing because the common polymorphisms have little clinical utility — yet people have pursued unnecessary supplements and worry based on them.
-
Treating APOE e4 as a verdict (Alzheimer's). Carrying an APOE e4 allele raises Alzheimer's risk statistically, but most e4 carriers never develop Alzheimer's and many patients carry none. Read as "I will get Alzheimer's," it causes needless distress without changing what you can actually do.
-
PRS that don't transfer across ancestry. Because most polygenic scores were trained on European cohorts, a score can be badly miscalibrated for someone of a different ancestry — a "90th-percentile" result may be an artifact of the wrong reference, not real elevated risk (Martin et al., Nat Genet, 2019).
The common thread: a number or a flag, taken in isolation and without population context, penetrance, and orthogonal validation, can point the wrong way. That is exactly why this tool shows the evidence and its limits rather than a verdict.
Does the quality of my DNA file affect the results?
Yes — a lot, and it is easy to miss. It helps to think of your genome file (the "VCF") as a typed-up transcript of your DNA, produced by a lab. just-dna-lite reads that transcript — it did not make the original recording. If the recording was rushed or low quality, the transcript already contains gaps and typos, and this tool can only work with what the transcript says. Put simply: if what went into the file was imperfect, what comes out will be too.
A few things happen at the lab, before the file ever reaches this tool, that can change your results:
-
Which "map" the file uses. DNA positions are written down against a reference map of the human genome, and there are a few versions of that map. If your file uses a different version than our databases expect, the positions don't line up and you get wrong or missing matches. (just-dna-lite currently expects the version called GRCh38; an older file may need to be converted first, and that conversion can quietly drop some variants.)
-
How carefully your DNA was read ("coverage"). Each spot in your DNA is read several times over; more reads means more confidence. Typical consumer sequencing reads each spot about 30 times — fine for exploring, but it can still miss things or make mistakes, especially in harder-to-read regions. A "clean-looking" result here is not the same as a careful clinical test.
-
Some parts of the genome are hard to read at all. Certain regions are so repetitive or complex that today's sequencing simply cannot read them reliably. A variant can be missing from your file just because that spot couldn't be read — not because you don't have it.
-
"Not listed" does not mean "normal." If a position isn't in your file, it can mean "the same as the reference," "couldn't be read," or "was filtered out." Those are very different situations, and software cannot always tell them apart.
The bottom line: this tool faithfully reports what your file says, and your file is only as good as the lab process that made it. Before treating any single finding as real, the safe step is to have it re-tested with a proper clinical-grade test at a certified lab and explained by a doctor or genetic counselor. That confirmation matters more than anything the app shows.
Walk me through it: I opened my genome, saw a "pathogenic" variant, and I'm scared
This is the most important scenario to get right, so here are two worked examples — what people actually feel, what is really going on, and a concrete checklist of what to do. (The person below is a composite, but every fact and number is from published studies.)
Scenario A — a "pathogenic" variant. Maria runs her whole-genome VCF, enables Ensembl annotation, and sees a BRCA1 variant labelled "pathogenic." Her stomach drops: she thinks she has been told she will get breast cancer.
What is actually going on:
- The variant call might not even be real. When Ambry Genetics clinically re-tested variants that direct-to-consumer raw data had flagged, about 40% were false positives — and 94% of those false alarms were in cancer-related genes like BRCA1/2 (Tandy-Connor et al., Genetics in Medicine, 2018). A single research-grade VCF is exactly the kind of data that produces these spurious "hits."
- Even if the variant is real, "pathogenic" is not "you will get the disease." Penetrance estimated from high-risk families (where everyone was tested because the family had cancer) is much higher than penetrance in the general population. In UK Biobank, observed BRCA1 penetrance to age 60 was about 34% and BRCA2 about 24% — real and important, but far from the ~70–80% figures often quoted from clinical families (UK Biobank hereditary-cancer penetrance study, 2023).
- The label reflects a database classification that can change — variants get reclassified from "pathogenic" to "benign" over time, sometimes with ancestry-driven errors (see the hypertrophic cardiomyopathy case above).
What to do — checklist:
- Pause. A flag is a hypothesis, not a diagnosis. Make no health decisions today.
- Write down the exact finding: gene, the variant identifier (rsID / HGVS), your genotype, and which module or database flagged it.
- Confirm it is real before anything else: order orthogonal clinical-grade testing (targeted Sanger sequencing or a clinical gene panel) from an accredited laboratory. Do not trust a single research VCF.
- Put it in context: your family history, the variant's population penetrance, and whether it was studied in people of your ancestry.
- Take it to a professional: a genetic counselor or clinician interprets confirmed results and decides whether screening is warranted.
- Do not schedule surgery, start/stop medication, or change major life plans based on the app.
Scenario B — a high polygenic risk score. Maria then computes a PRS and lands in the 95th percentile for coronary artery disease. She reads it as "95% chance of a heart attack."
What is actually going on:
- A percentile is a rank, not a probability. Being in the 95th percentile means her score is higher than 95% of a reference population — it is not a 95% chance of disease, and it is not a diagnosis.
- The reference population may not match her. Most PRS were built from European-ancestry cohorts, and a score can be badly miscalibrated for other ancestries, producing a falsely "high" or "low" rank (Martin et al., Nature Genetics, 2019).
- Models disagree, and coverage matters. Different PRS for the same disease can put her in different percentiles, and a low variant match-rate means only part of the model was applied.
- For common disease, modifiable factors usually matter more. Blood pressure, lipids, smoking, and activity have larger, actionable effects than a common-variant score, and validated clinical calculators already incorporate them.
What to do — checklist:
- Read it as a rank, not a verdict or a probability.
- Check the fit: does the reference ancestry match yours, and what is the model's quality tier and variant match-rate? just-prs shows these.
- Compare with the basics: family history and standard risk factors (lipid panel, blood pressure) are more informative and more actionable than the PRS alone.
- If genuinely concerned, see a clinician for a standard, validated cardiovascular risk assessment — not a decision driven by the PRS number.
- Use it as motivation, not a sentence: the productive response to a high score is attention to modifiable risk factors, not panic.
In both scenarios the pattern is the same: the danger is not in looking — it is in acting on research-grade results without confirmation and professional interpretation. Looking at your own genome is your right; treating an app's flag or rank as a clinical result is the mistake to avoid.
I've read about people who treated their own (or their pet's) cancer using data and AI — can I do that with this tool?
No — and it's important to be clear about why, even though those stories are real and genuinely thought-provoking.
Two cases have been widely shared. A Croatian virologist, Beata Halassy, treated her own recurrent stage-3 breast cancer by injecting lab-grown viruses (oncolytic virotherapy) into the tumour; it regressed, was surgically removed, and she has been cancer-free for about four years — published as a case report in Vaccines in 2024 (case report). And a tech entrepreneur, Paul Conyngham, used AI tools to help design a personalized mRNA vaccine for his dog's terminal cancer, which a university lab then manufactured (Newsweek, 2026).
We find these inspiring, and they are part of why we believe people should have open access to their own data and to good tools. But please read them carefully, because the caveats matter as much as the headlines:
- Both people were experts. One is a professional virologist; the other has years of machine-learning and data experience and worked with a university RNA institute. Neither was a layperson following an app.
- They took large personal risks, and each is a single anecdote — not proof that the approach is safe or that it generalises. Halassy's own report was rejected by more than a dozen journals on ethical grounds before publication.
- This tool does none of that. just-dna-lite annotates the variants already in your file and computes polygenic scores. It does not design drugs, vaccines, or treatments, and nothing in it should be used to self-treat any condition.
The honest lesson of these stories is not "you can cure yourself at home." It is that access to data, open tools, and knowledge can empower people working with professionals — and that is the spirit in which this tool is meant to be used. If you are facing a serious diagnosis, the right move is to bring what you find here to a clinician, not to act on it alone.
AI Module Creator
What is the AI Module Creator?
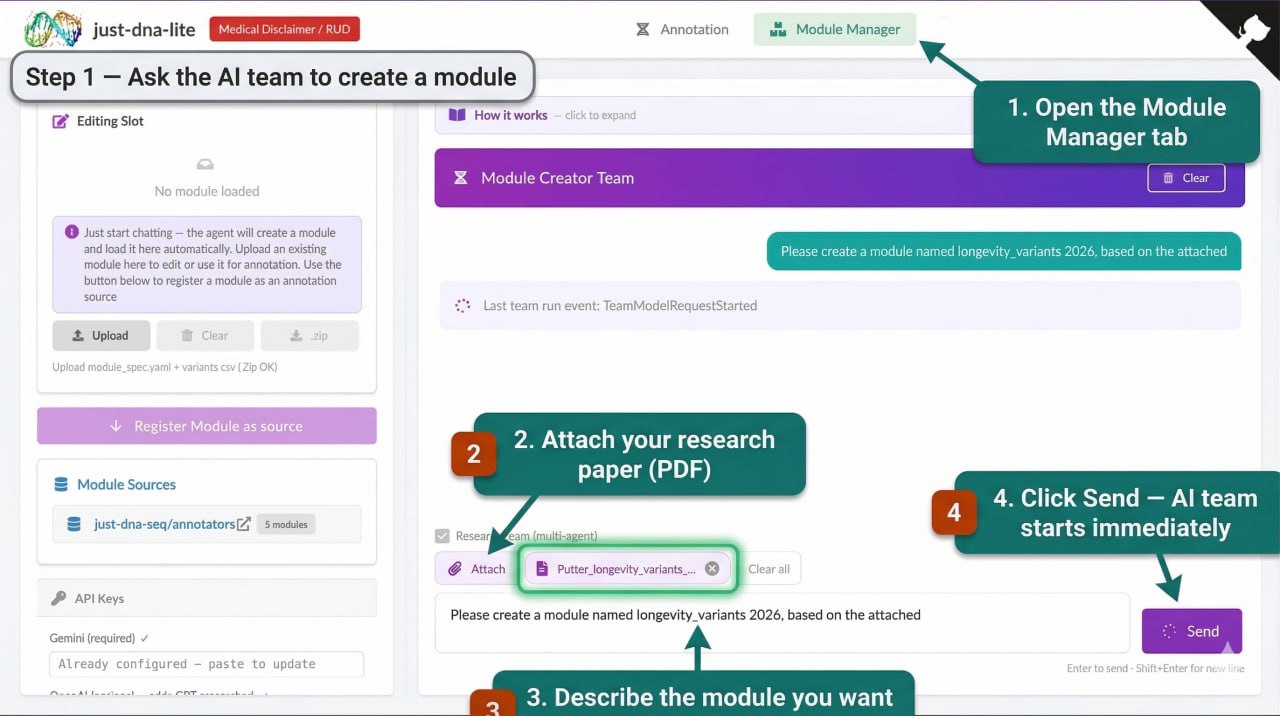
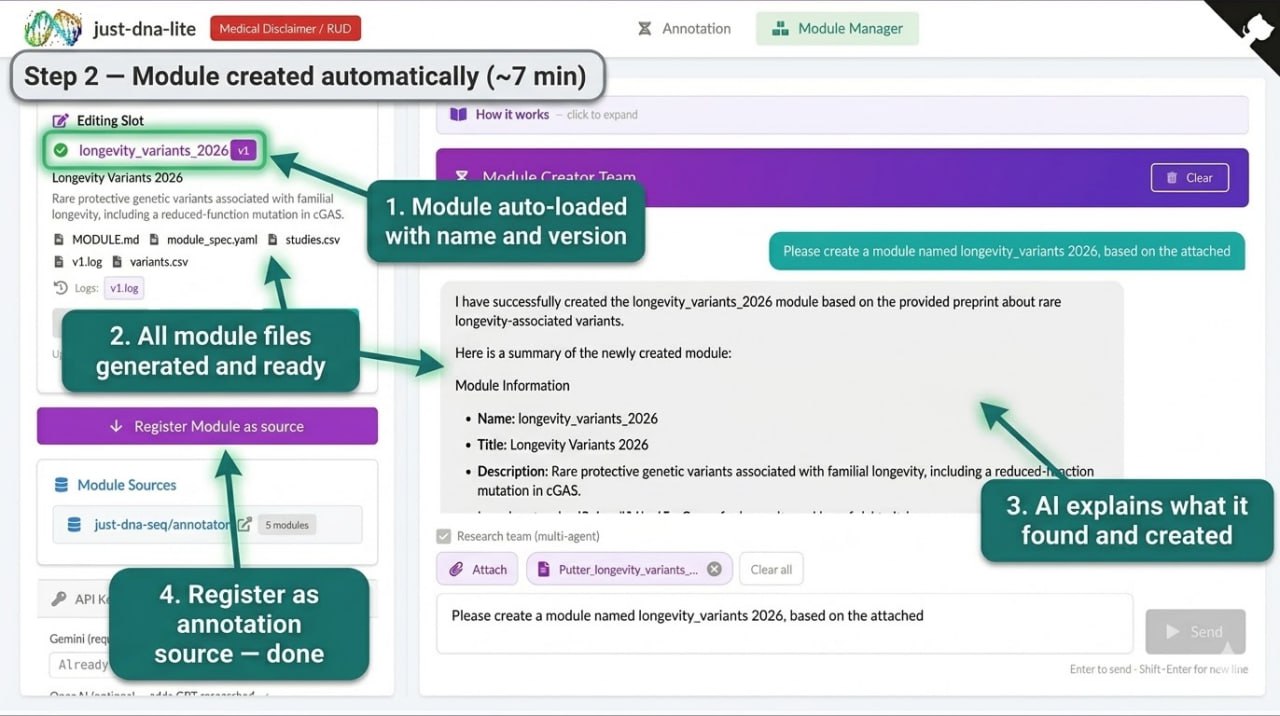
An agentic pipeline that turns a research paper (PDF, CSV, or text description) into a validated annotation module. You upload a paper, describe what you want, and the AI reads it, queries biomedical databases (EuropePMC, Open Targets, BioRxiv), extracts variants, and produces a ready-to-use module.
How reliable are AI-generated modules?
They are automated first drafts, not expert-curated databases. They will contain mistakes. The research team mode mitigates this by running multiple language models independently and only keeping variants confirmed by at least two, but errors still happen. Every AI-generated module is labeled as such (the curator field says "ai-generated"). Review the output before relying on it.
What is the difference between simple mode and research team mode?
- Simple mode: One AI agent handles everything. Faster (~2 minutes), good for a single well-defined paper.
- Research team mode: A Principal Investigator dispatches up to three Researcher agents (different language models) in parallel, then a Reviewer fact-checks via web search. Takes ~7–8 minutes, but cross-model agreement reduces hallucination.
Do I need API keys for the AI Module Creator?
You need at least one LLM API key. Any powerful model works — including local ones via an OpenAI-compatible API (e.g. Ollama, vLLM). We have mostly tested with Gemini because free API keys are easy to get at Google AI Studio (short video on how), but GPT, Claude, and other models work too — some better, some worse, since prompts behave differently across models. In research team mode, having keys for multiple providers (Gemini + OpenAI + Anthropic) lets the system run different models as independent researchers in parallel, which improves quality through cross-model agreement.
Everything else in just-dna-lite (annotation, PRS, self-exploration) works without any API keys.
Can I create a module by hand without AI?
Yes. A module is just a directory with two files: module_spec.yaml (metadata) and variants.csv (variant table with rsID, genotype, weight, state, conclusion, gene). No programming required. See the README for the format.
Privacy and Data
Does my data leave my computer?
No. All computation happens locally. The VCF file is never transmitted to any external server. Annotation databases are cached locally after a one-time download. Results are stored on your local filesystem.
What about the annotation databases?
They are downloaded once from HuggingFace, Zenodo, or other sources, then cached locally (~/.cache/just-dna-pipelines/). After that, everything runs offline. The downloads contain reference data, not your personal data.
Can my employer, insurer, or government access my results?
Not through this tool. Everything runs on your machine and nothing is uploaded, so there is no server for anyone to subpoena or hack. Your genome data stays in the folders you choose, protected by your operating system's file permissions. If physical access to your computer is a concern, use disk encryption and strong passwords.
Why can't I upload my genome on the public demo?
Processing personal genomic data on a shared server triggers GDPR, HIPAA, and other data protection regulations requiring extensive compliance infrastructure. The demo only works with genomes already published on Zenodo under permissive licenses — if you have published yours there, you can import it via the Zenodo URL. We currently support only Zenodo because it is a reputable repository with clear, machine-verifiable open licenses; support for other trusted repositories is planned. For private genomes, install just-dna-lite locally — see the Quick start.
Legal and Regulatory
Is this a medical device?
No. just-dna-lite is a bioinformatics research tool for academic studies, citizen science, and educational self-exploration. It is not approved, cleared, or certified by any regulatory body (FDA, EMA, or equivalent) and is not intended for clinical diagnostic use.
What is the difference between research-grade and clinical-grade evidence?
For a genetic finding to be clinical-grade, it needs to be demonstrated — in well-designed prospective studies — that knowing the result changes patient outcomes. It needs to work across diverse populations, be reproducible under routine laboratory conditions, and the benefits must outweigh the harms.
Very little of genomics has cleared that bar. The exceptions include BRCA1/2 for breast/ovarian cancer, pharmacogenomic variants like CYP2C19 and HLA-B*57:01, and monogenic conditions like Huntington's. Most complex trait polygenic scores are science-grade — they tell you something real about population distributions but do not predict individual outcomes.
Our tool surfaces research-grade evidence. It is genuinely informative if you understand what the numbers mean, but it is not a substitute for clinical testing when clinical testing is warranted.
Is this GDPR-compliant?
The architecture is GDPR-friendly by design. All data processing happens locally, so you are the data controller. There is no third-party data processing, no cloud upload, and no data sharing. The open-source code allows anyone to audit every line that touches their data.
For public demos and workshops, the app has an immutable mode that blocks all user uploads and only works with genomes that their owners have already voluntarily published on Zenodo under open licenses (CC-Zero, CC-BY, etc.). These are still personal genomes, but their owners chose to make them public — the demo server does not accept anyone else's data.
What is the license?
AGPL v3. The software is provided "AS IS", without warranty of any kind. See the full LICENSE. The AGPL allows commercial use, but derivative works distributed or offered as a network service must also be released under AGPL v3 with full source code.
Technical
How fast is annotation?
About 39 seconds for a whole-genome VCF (~6.1 million variants) against the default modules, with peak RAM under 750 MB. Cold start (first run, cache initialization) takes about 203 seconds. These numbers are from a server with HDD storage — SSD and modern laptops will be faster.
What technologies does it use?
Dagster (pipeline orchestration), Polars (data processing), DuckDB (out-of-core SQL joins), polars-bio (VCF reading), Reflex (web UI, pure Python), and just-prs (PRS computation).
What output formats are available?
Primary outputs are Parquet files (Polars, Pandas, DuckDB, R, or any Arrow-compatible tool). PDF/HTML reports are generated per annotation run. VCF export produces standard VCF files with annotations in the INFO column.
How do I report a bug or request a feature?
Open an issue on GitHub. Pull requests are welcome.